

Which should companies prioritize: job satisfaction, ease of work, or work performance?
Haruki Ohsawa, CEO of OpenWork Inc., provides commentary in a three-part series of articles on a paper regarding research on the relationship between job satisfaction, ease of work, and corporate performance.
In today’s column, Part 2 of the three-part series, we highlight how to quantify job satisfaction and ease of work.
My name is Haruki Ohsawa, and I’m the CEO of OpenWork, a company that provides a job market platform for job seekers that offers more than 11 million word-of-mouth posts and evaluation scores.
In this, the second installment of this three-part series, let’s take a look at how job satisfaction and ease of working are quantified in the first place.
(Click here to read the previous column.)
A recipe for quantifying job satisfaction and ease of work that even novices to machine learning can understand
In today’s article, I’ll explain step by step how we can quantify job satisfaction and ease of work.
We’ll start things off with some basic knowledge. In May 2014, Japan’s Ministry of Health, Labor and Welfare issued its “Research Report on Creating Comfortable and Fulfilling Workplaces,” which defined job satisfaction and ease of work as follows.
Job satisfaction = Work worth doing
Ease of work = Minimal working hardships and barriers
It is quite challenging to quantify something of this degree of abstraction, which is so greatly influenced by subjectivity. Therefore, in this research, we took a different approach, converting each person’s subjectivity into a score. (This should be recognized as a rather common approach among those familiar with artificial intelligence.)
Please forgive me for singing my own praises, but OpenWork, which we operate, boasts one of Japan’s largest databases of word-of-mouth company reviews and, in terms of quality, is the source of information for domestic research institutes and overseas hedge funds for investment decisions.
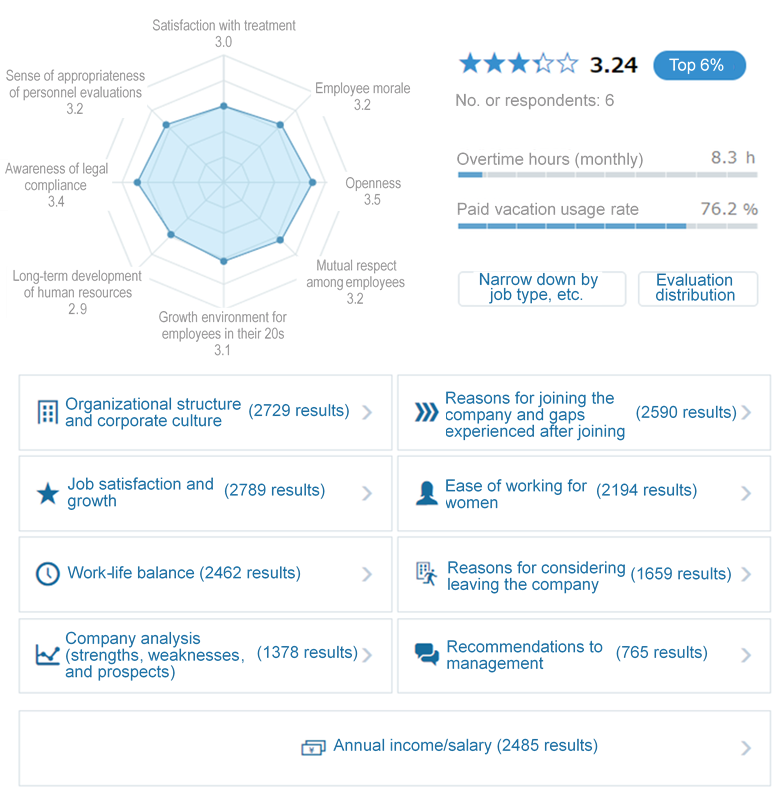
The structure of OpenWork’s word-of-mouth feedback is as follows.
Eight quantitative evaluations: satisfaction with treatment, employee morale, openness, mutual respect among employees, growth environment for employees in their 20s, long-term development of human resources, awareness of legal compliance, sense of appropriateness of personnel evaluations
Eight qualitative evaluations: organizational structure and corporate culture, reasons for joining the company and gaps experienced after joining, job satisfaction and growth, ease of working for women, work-life balance, reasons for considering leaving the company, company analysis (strengths, weaknesses, and prospects), recommendations to management
Three actual figures: annual income/salary, overtime hours, paid vacation usage rate
This qualitative word-of-mouth/evaluation score item structure was created from scratch at the time that OpenWork (formerly Vorkers) was founded. It makes use of management science, social systems theory, and behavioral economics, as well as various research papers to provide a comprehensive and numerical picture of what “work” is.
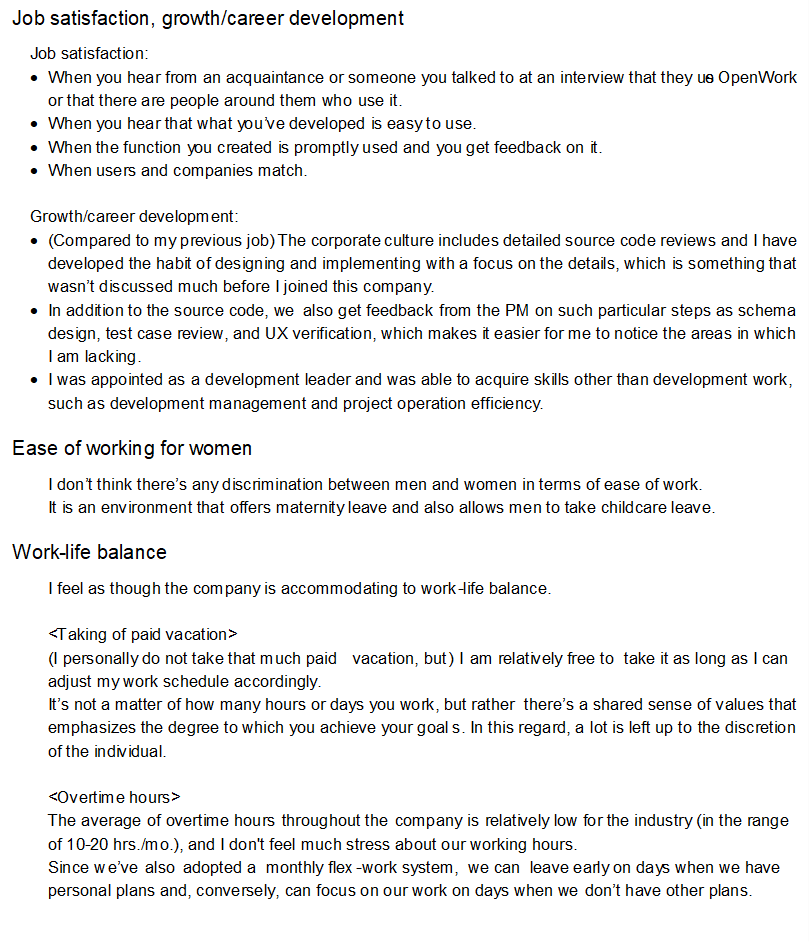
In our research we scored “job satisfaction” and “ease of work” from the following word-of-mouth feedback.
Job satisfaction = Job satisfaction and growth
Ease of work = Work-life balance, ease of working for women
Let’s take a look at some examples of word-of-mouth feedback for each (translated from Japanese).
So, how do we score this? First, let’s quote a formula from the research paper.
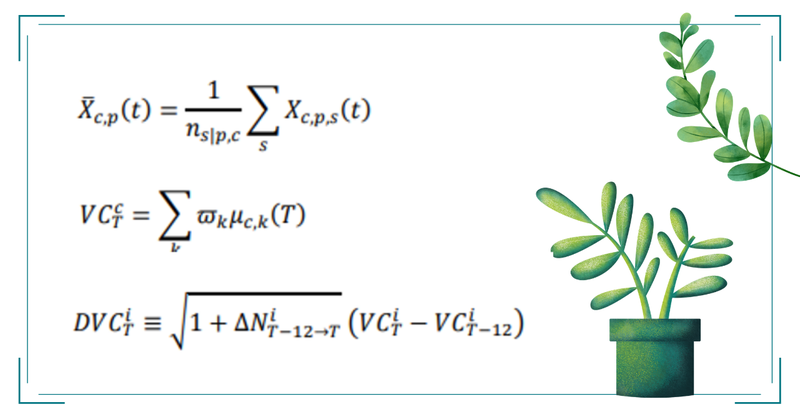
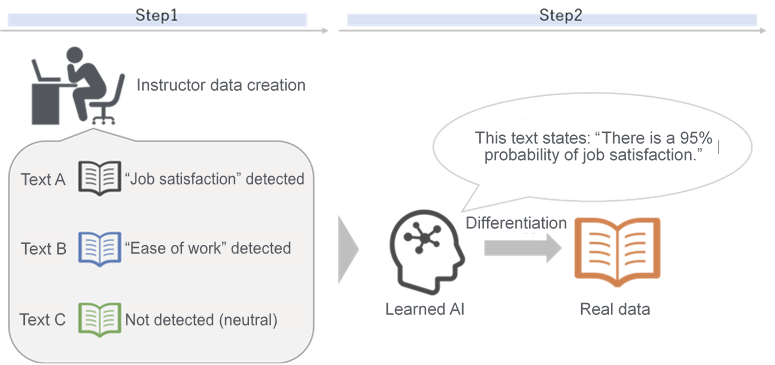
Let me provide a brief explanation and I’ll try to make it as easy to understand as possible. It’s a two-step process and we’ll be using sentiment analysis (a method to analyze sentiment—positive, negative, neutral, mixed—from text).
Step 1: Create the instructor data. Based on a set of rules, create data to be fed to the machine, e.g., “Job satisfaction” detected in this text, “Ease of work” detected in this text.
Step 2: The machine learns from the instructor data and scores the input text as “job satisfaction” or “ease of work.”
In our research, we focused on the degrees of change in “job satisfaction” and “ease of work” based on this type of sentiment analysis.
As for why we chose to study the correlation between the degrees of change and financial indicators instead of absolute values, here are our reasons:
- Prior research indicates that, between the two, the degree of change has a stronger impact on financial indicators.
- Actually, employees feel degrees of change more than absolute values (they are affected more by whether things are better or worse than they used to be than by whether things are considered to be high or low).
In my next article, I will once again refer to these research findings.
This article was published with the permission of Haruki Ohsawa of OpenWork. It has been partially modified from its original format. The original article (in Japanese) can be viewed here.
Reference:
- Haruki Ohsawa note (in Japanese) “Which comes first in contributing to raising corporate value: work performance or job satisfaction? An AI analysis of more than 11 million employee word-of-mouth company reviews”
- OpenWork is a job and recruitment information platform that utilizes one of Japan’s largest databases of employee reviews
- OpenWork Recruiting is a recruiting platform that provides a direct scouting service.